
- August 8, 2019
“A picture tells a thousand words”. Hear this phrase and your mind may jump to your favourite piece of art, or perhaps a holiday photo perfectly capturing a moment in time. Unless you work in a creative industry, work probably doesn’t spring immediately to mind.
But how often in your working life have you sat through a ‘death-by-PowerPoint’ presentation, or forced yourself to plough through a dense report with slides or pages crammed full of text or numbers? How did you feel looking at this? How much of the content did you retain? Did the intended key messages land?
If you struggled to digest the information that was being attempted to be conveyed, don’t worry, you are not alone!
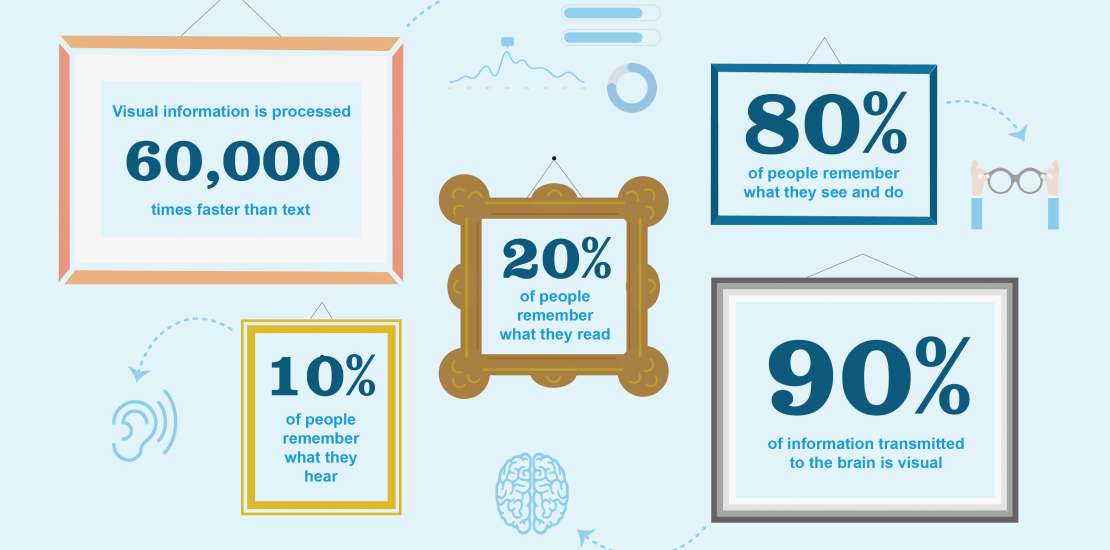
Research suggests that the human brain values visual information far more than any other type of information, with visual information being processed up to 60,000 times faster than text. According to Clarity, 10% of people remember what they hear, 20% of people remember what they read, but over 80% of people remember what they see and do. An MIT study suggests that a staggering 90% of the information transmitted to the brain is visual. Quite simply, visual information invites more interest and intrigue than written information, as well as conveying messages more quickly and memorably.
Of course, not everything can be presented visually and written documents and reports have their place, but why do many businesses continue to rely so heavily on these? In an increasingly information-overloaded world, how we present information has never been so important. According to the Telegraph, we are exposed to five times more information today than we were in 1986. What might the impact be if we made a shift in how we presented information to our staff, managers and clients towards a more visual style?
A common concern is not having the skills to do this. Whilst there is a plethora of expensive software and specialists out there, visualisations do not need to be complex or technical to be effective. There are a number of free tools and pieces of software available, and in a day-to-day operational environment, even a simple whiteboard can be highly impactful in visualising key operational information ‘at a glance’ and providing a focal point, as well as instilling ownership and accountability within a team.
As Al Shalloway eloquently describes, “Visualisations act as a campfire around which we gather to tell stories”. So, next time you are writing a report or a presentation, take a moment to remember how the brain most easily processes information and answer the following questions about your work: What do I want people to remember? What questions am I hoping to provoke? What is the story I am trying to tell?